
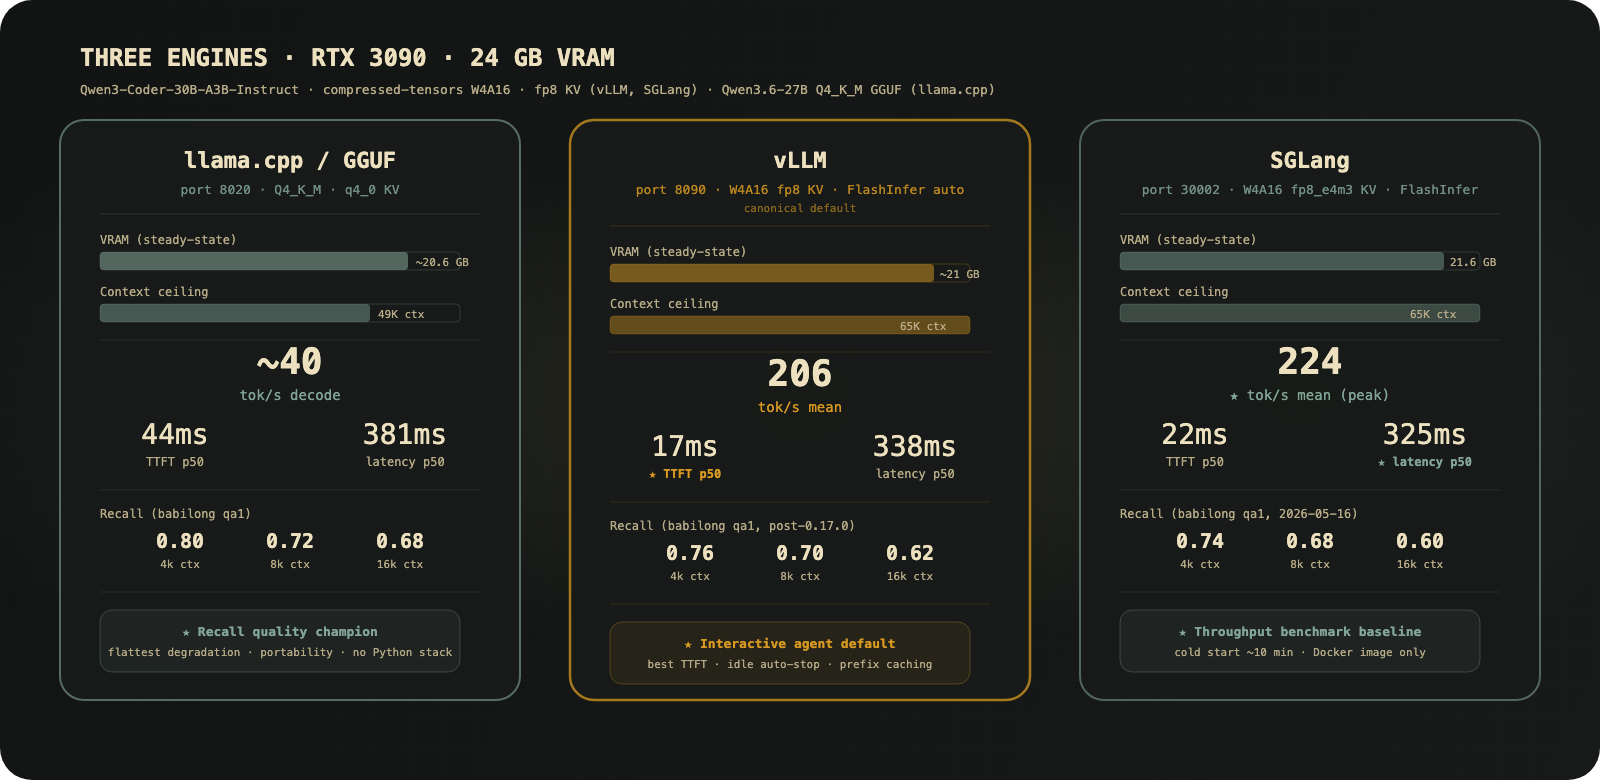
RTX 3090, 24 GB VRAM. vLLM as the interactive default (p50 TTFT 17ms), SGLang for throughput, llama.cpp Q4_K_M as the recall quality baseline. One Go gateway routes all clients. Prometheus scrapes both local and VPS agent-proxy into a single Grafana instance. Qwen Scope SAE activations feed a live feature semantics dashboard. And: the SGLang-beats-vLLM result inverted two days later because the Docker image updated.
The Big Picture
Here’s what the lab looks like end to end:
Every AI coding client I use routes through a single gateway. The gateway decides: local GPU or cloud provider. Prometheus scrapes everything. Grafana shows me the picture. And the SAE probe runs alongside inference, telling me what the model’s neurons are actually doing.
Now let me break it down piece by piece.
The Model Gateway: agent-proxy
Before inference, routing. Every AI coding client I use points at a single gateway URL. Not at a cloud provider directly, not at a local IP that changes.
agent-proxyd is a headless Go service exposing both OpenAI-compatible and Anthropic-compatible surfaces. It runs as a systemd service on the VPS and mirrors to the GPU host. Both are reachable via their Tailscale hostnames on port :8686.
The core design decision: provider auth and model routing live on the gateway host, not on every client machine. When I want to route a model alias to local GPU inference instead of a cloud provider, I change one config. No client reconfiguration. The local vLLM server runs at http://127.0.0.1:8090, declared as an openai-api provider with that base URL. Clients pointing at the Tailscale address route transparently to GPU inference.
Secrets stay on the host. API keys are never distributed.

Observability
Every request goes through OpenTelemetry instrumentation with OpenInference attributes. The gateway writes append-only sanitized JSONL daily: events-YYYY-MM-DD.jsonl and sessions-YYYY-MM-DD.jsonl to a local state_dir. Sessions are grouped by clientID + projectPath with 100-message history.
The telemetry schema (v1.0) captures the full picture per request:
{  "schema_version": "1.0",  "event_id":        "evt_<ulid>",  "task_id":         "task_<ulid>",  "session_id":      "sess_<ulid>",  "turn_index":      3,
  "harness": {    "id":          "pi",    "version":     "0.14.2",    "working_dir": "/home/user/project"  },
  "model": {    "alias":          "qwen3-coder-30b",    "provider_id":    "local-vllm",    "upstream_model": "Qwen/Qwen3-Coder-30B-A3B-Instruct",    "quantization":   "compressed-tensors W4A16",    "n_ctx":          65536  },
  "timing": {    "ttft_ms":     17,    "tok_per_sec": 206.6,    "started_at":  "2026-05-16T07:47:52.123Z",    "ended_at":    "2026-05-16T07:47:52.890Z"  },
  "usage": {    "prompt_tokens":     2048,    "completion_tokens": 142,    "cached_tokens":     1024  },
  "judgment":     null,  "rl_metadata":  null}
Redaction is deterministic before anything is written: API keys, JWTs, emails, phone numbers, IP addresses, filesystem paths, URLs with embedded credentials. system_prompt.sha256 is computed over the sanitized text so hashes are shareable across machines without leaking content.
OTEL metrics cover requests, errors, latency, and token throughput, fed into Prometheus and surfaced in Grafana. Jaeger and Langtrace are both supported for distributed tracing. The React dashboard at ui/src/pages/ exposes gateway health, provider status, model catalog, session drill-down, and per-harness TTFT and tok/s columns.
Querying history is DuckDB over the JSONL files:
SELECT timestamp, harness_id, model_alias, ttft_ms, tok_per_sec, input_tokens, output_tokensFROM eventsWHERE schema_version = '1.0'ORDER BY timestamp DESCLIMIT 10;Dataset collection (in progress)
Because the proxy sits in the critical path for every harness, it’s the right place to collect preference data. No per-harness instrumentation needed. One proxy captures everything. A telemetry extension spec defines three capture layers:
Layer A, Full I/O capture. A new JSONL stream at io/YYYY-MM-DD.jsonl persists complete prompt_messages and response_message arrays post-sanitizer. Schema versioned, streaming responses accumulated before write, failure to write does not fail the request.
Layer B, Implicit signals. followup_latency_ms, was_interrupted, session_continued, prompt_is_correction (regex-matched on corrective phrasing). These scale automatically with no user action required, and they’re surprisingly informative for preference modeling.
Layer C, Explicit preference signals. One-keystroke good/bad from harness clients. Planned, not shipped.
My thesis: training on proxy telemetry without outcome labels teaches a model to mimic its past outputs. With implicit signals and explicit labels, the proxy becomes the source of truth for a real preference dataset.
Research Memory: NomFeed
NomFeed is my personal knowledge base CLI, covered in detail here. Every benchmark run, paper, and architecture decision gets saved as searchable markdown. The storage model is intentionally simple: ~/.nomfeed/items.json for the index, ~/.nomfeed/content/{id}.md for content. No database. Grep works.
In the lab context, NomFeed is the research trail. Benchmark result summaries are entries. The plan is to use NomFeed context bundles as portable eval inputs for replay and training.
Network: Tailscale
Three machines are on the same Tailscale mesh: the GPU lab host, my Mac, and the Hostinger VPS. Each has a stable tailnet hostname. No port forwarding, no dynamic DNS, no firewall rules for internal traffic.
The practical consequence for agent-proxy: clients on any of these machines resolve the GPU host’s tailnet address and reach the local inference server as if it were a cloud endpoint. The provider config in agent-proxy is just:
providers: - id: local-vllm kind: openai-api base_url: "http://127.0.0.1:8090" responses_via_chat_completions: trueWhen the gateway is on the GPU host itself, 127.0.0.1:8090 is the vLLM container. When a remote client routes through the VPS gateway, the VPS config points to the GPU host’s tailnet address instead.
One caveat: Tailscale routing for ports 443, 8283, and 8383 is owned by Letta (my local self-hosted deployment). The agent-proxy gateway sits on :8686 to avoid those conflicts.
Workspace: Zellij
Zellij handles my workspace layout for the lab workflow. Persistent named sessions, multiple panes for parallel inference server management, log tailing, benchmark runs. Named workspace keybindings are configured per-project in ~/.zshrc so switching between the inference pane, the benchmark runner, and the log tail is a single keystroke.
The key thing Zellij gives me over a basic tmux setup is that sessions survive SSH disconnects and reconnects with the full layout intact. Critical when a benchmark run takes 20+ minutes and I’m working over Tailscale.
Models Tested
I ran three models through the benchmark suite:

The Qwen3-Coder-30B-A3B-Instruct weights directory is labelled “AWQ” but that’s wrong. The actual quantization is compressed-tensors W4A16 (group_size=128, INT4), per the model’s quantization_config in config.json. vLLM auto-detects this. SGLang requires --quantization compressed-tensors explicitly or it will reject the weights.
The Qwen3.6-27B GGUF is the Unsloth Q4_K_M variant with a vision projector (mmproj-F16.gguf, ~0.9 GB). The vision tower is loaded but unused in these text-only benchmarks; it reduces the effective context budget by holding ~1 GB of the KV budget.
Hardware constraints
RTX 3090, 24 GB VRAM. Single GPU, so tensor-parallel-size must be 1. I hit two OOM cliffs with this model:
- Cliff 1: ≥25K tokens + TQ3 KV quantization + high memory utilization causes prefill activation OOM. This is peak activation memory during prefill, not the KV cache.
- Cliff 2: Single prompt >50-60K tokens causes GDN state buffer OOM. Same category, activation peaks, not KV.
Know these cliffs before you tune --gpu-memory-utilization upward.

Inference Engine 1: llama.cpp / GGUF
First path I tested. Qwen3.6-27B-Q4_K_M.gguf (Unsloth variant, ~16 GB) via llama.cpp Docker on port 8020. Qwen2.5-3B-Instruct GGUF ran on the same port for fast iteration and smoke tests. Swap the model path, restart.
Launch flags for the 27B model:
-ngl 99 -c 262144 -fa on --cache-type-k q4_0 --cache-type-v q4_0Profile: ~40 tok/s decode, flat across context length. Low overhead, no Python serving stack, portable. Practical context ceiling is 49K (vs 65K for the HF weight paths). Docker is the cleaner serving path here.
The recall result matters. Q4_K_M is meaningfully more accurate than compressed-tensors W4A16 at longer contexts. The per-token precision difference shows up consistently above 8K tokens. If recall quality is the primary constraint, llama.cpp is the right engine.
Inference Engine 2: vLLM
My current default. vllm/vllm-openai:latest Docker on port 8090:
--context-length 65536--gpu-memory-utilization 0.90--kv-cache-dtype fp8--max-num-seqs 64--enable-chunked-prefill--enable-prefix-cachingIdle lifecycle: auto-stop after 60 minutes without chat-completions traffic via a systemd --user timer. Source of truth for flags lives in scripts/vllm-local.env.
Strong TTFT, p50 ~17ms. For interactive agent use where I’m waiting on the first token to start streaming, this matters. The latency before the model says anything determines how responsive the tool feels.
Inference Engine 3: SGLang
My latest experiment. lmsysorg/sglang:latest on port 30002:
--context-length 65536--mem-fraction-static 0.85--kv-cache-dtype fp8_e4m3--quantization compressed-tensorsAttention backend: FlashInfer (SGLang default).
The cold start problem: weight load is ~23 seconds, but CUDA graph capture across batch sizes [1, 2, 4, 8, 12, 16, 24] takes roughly 10 minutes total. For iterative work, leave the container running.
The torch conflict: uv pip install "sglang[all]" downgrades torch 2.11.0 to 2.9.1 and transformers 5.7.0 to 4.57.1. Use the Docker image.
Benchmarks
Systems baseline
4 prompts, 5 measured runs, max_tokens=160:
| Metric | vLLM | llama.cpp | SGLang |
|---|---|---|---|
| tok/s mean | 206.27 | 194.20 | 224.46 |
| tok/s median | 189.85 | 178.05 | 202.04 |
| TTFT p50 (ms) | 16.92 | 44.21 | 22.50 |
| Latency p50 (ms) | 338.44 | 381.15 | 325.11 |
SGLang wins throughput (+9% vs vLLM, +16% vs llama.cpp) and total latency. vLLM wins cold TTFT by a significant margin.
Deep recall sweep
n=50, babilong qa1 dataset via PrimeIntellect verifiers:
| Context | vLLM | llama.cpp | SGLang |
|---|---|---|---|
| 4k | 0.72 | 0.80 | 0.74 |
| 8k | 0.64 | 0.72 | 0.68 |
| 16k | 0.56 | 0.68 | 0.60 |
llama.cpp wins recall quality at every context level. The GGUF Q4_K_M precision advantage is real. SGLang beats vLLM on identical weights, or so I thought, as of 2026-05-14.
The FlashInfer Investigation

This is the part worth reading carefully, because my experiment failed in a way that taught me more than a clean result would have.
The original hypothesis
SGLang runs FlashInfer by default. My vLLM config didn’t specify an attention backend explicitly. My hypothesis: SGLang was outscoring vLLM on the same weights because of FlashInfer vs whatever vLLM was using.
To test this, I tried to A/B vLLM’s attention backend: FLASHINFER vs TRITON_ATTN.
Path B crashed immediately:
ValueError("type fp8e4nv not supported in this architecture. The supported fp8 dtypes are ('fp8e4b15', 'fp8e5')")Triton attention cannot handle fp8_e4m3 KV cache on Ampere. The hardware path Triton needs for that dtype only exists on Hopper+. The A/B test was untestable on my hardware with fp8 KV.
The accidental finding
When I restored the canonical vLLM config (no --attention-backend flag), I actually read the engine startup log this time:
Using FLASHINFER attention backend out of potential backends: ['FLASHINFER', 'TRITON_ATTN']vLLM 0.17.0 already auto-selects FlashInfer for this config on Ampere. My “canonical” baseline run, the one I’d been comparing against, had been FlashInfer all along. I was never testing FlashInfer vs something else. There was no something else available.
Re-running with explicit FlashInfer flag
I re-ran the recall sweep with --attention-backend FLASHINFER set explicitly (same canonical config otherwise):
| Context | vLLM 2026-05-14 | vLLM 2026-05-16 (explicit FlashInfer) | SGLang 2026-05-16 |
|---|---|---|---|
| 4k | 0.72 | 0.76 | 0.74 |
| 8k | 0.64 | 0.70 | 0.68 |
| 16k | 0.56 | 0.62 | 0.60 |
My “SGLang beats vLLM on identical weights” finding from two days prior had inverted. vLLM now beats SGLang at every context level.
What actually happened
The improvement was not from the explicit --attention-backend flag. It was from library version drift between Docker image pulls. Both runs auto-selected FlashInfer because it’s the only viable Ampere backend for fp8_e4m3 KV. What changed was vllm/vllm-openai:latest itself: the 2026-05-16 pull was vLLM 0.17.0 + flashinfer 0.6.4. The original pull was an earlier build.
The A/B design I intended, isolating attention backend as the variable, was not what I ran. I ran a before/after across a library update without intending to.
If you’re comparing inference engines across time using :latest Docker images, a result that “inverts” is more likely a library update than a measurement error. Pin image digests if you want reproducibility.
Practical conclusion
I’m keeping vLLM as my interactive agent default. TTFT and throughput are now on par with SGLang after the library update. llama.cpp still wins recall quality because Q4_K_M is more accurate than W4A16 at longer contexts, and that doesn’t change with vLLM version bumps.
The FlashInfer investigation taught me that on RTX 3090 with fp8_e4m3 KV, there is no attention backend choice to make. FlashInfer is selected automatically because it’s the only option. Tuning the --attention-backend flag on Ampere with this dtype is not a lever.
Engine Selection Summary
| Use case | Engine | Reason |
|---|---|---|
| Interactive agent default | vLLM | Best TTFT (p50 17ms), strong throughput post-0.17.0 update |
| Throughput benchmark baseline | SGLang | Highest mean and median tok/s in stable benchmarks |
| Recall quality / long-context accuracy | llama.cpp | Q4_K_M consistently outscores W4A16 compressed-tensors at every context length tested |
| Fast iteration / dependency-free | llama.cpp | No Python serving stack, Docker is clean |
Grafana: One Dashboard for Two Deployments
The Prometheus scrape config is where the multi-host story lands. Prometheus runs locally on the GPU host and scrapes two agent-proxy instances as separate jobs:
scrape_configs: - job_name: agent_proxy_local static_configs: - targets: ["127.0.0.1:8686"] # GPU host gateway
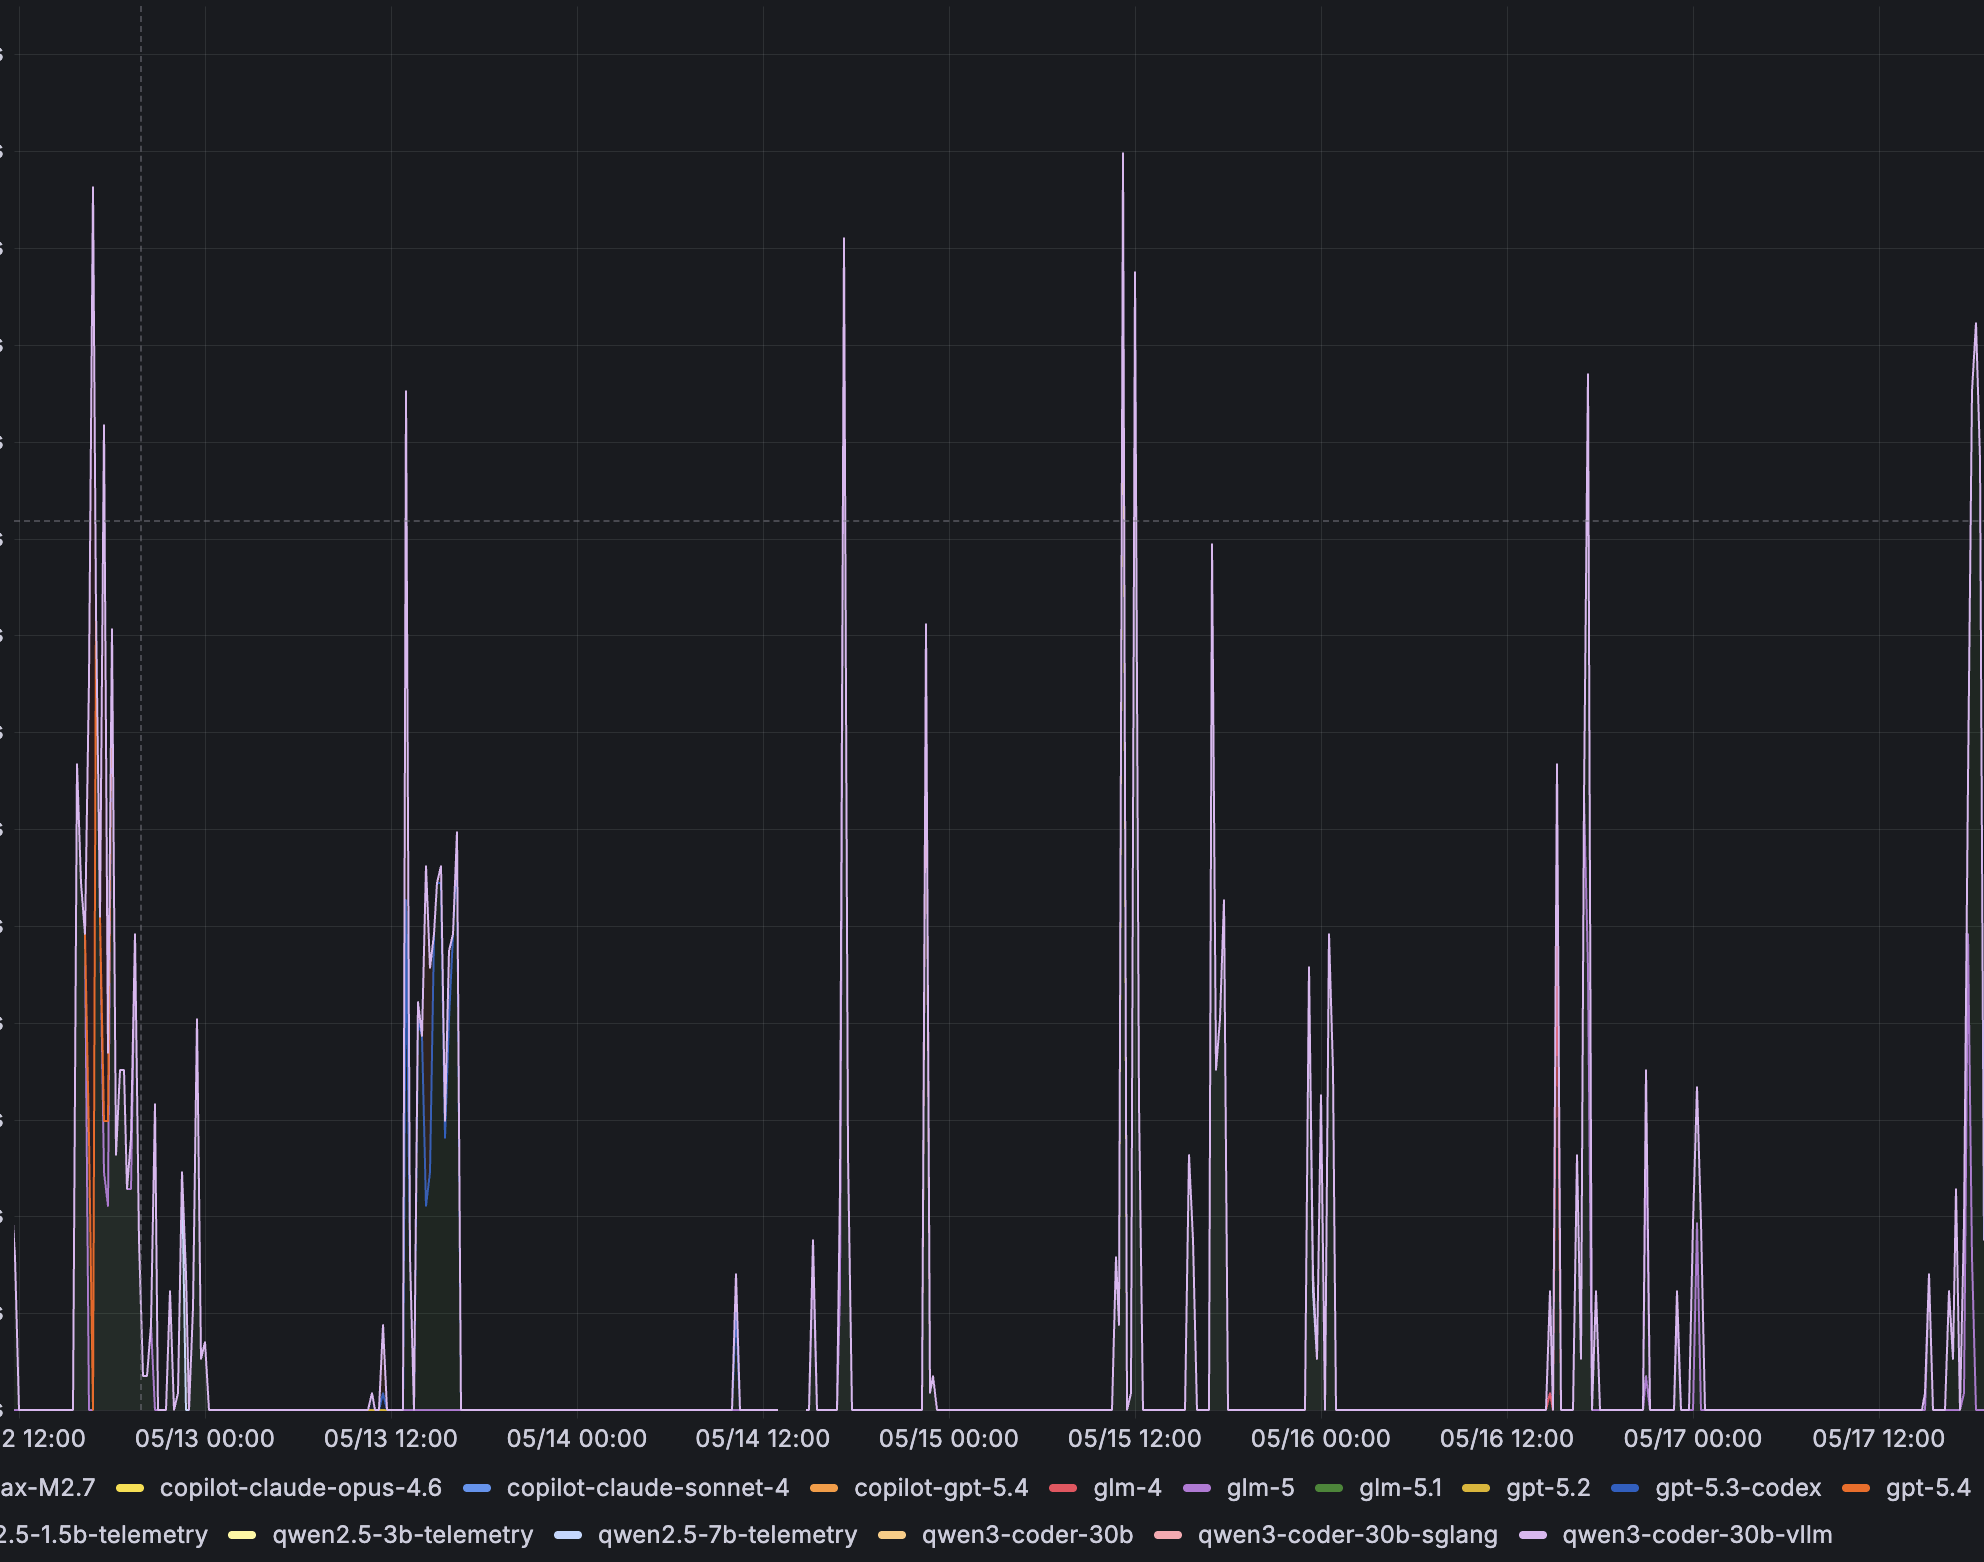
- job_name: agent_proxy_vps static_configs: - targets: ["hostinger-gateway.<tailnet>.ts.net"] metrics_path: /agent-proxy/metrics scheme: https # VPS exposed over Tailscale HTTPSThe Hostinger VPS runs a public-facing agent-proxy for cloud model routing. The GPU host runs a private instance for local inference. Prometheus on the lab machine scrapes both via the Tailscale mesh. Both land in the same Grafana instance. The provisioned dashboards automatically break down by job label, so a single “Agent Proxy, Model Detail” view shows cloud traffic and local GPU traffic side by side.
Dashboard layout
Five active dashboards, all provisioned from ~/services/grafana/dashboards/ with 30-second reload:
AI Lab, Overview is the first screen I check. GPU temperature, utilization, VRAM used, power draw. llama.cpp generation throughput (tok/s) and slot utilization. agent-proxy request rate by model, token throughput, per-model latency. Host CPU and memory. Plus live SAE probe stats, coverage and latency by SAE pair, so model serving and SAE telemetry share one view.
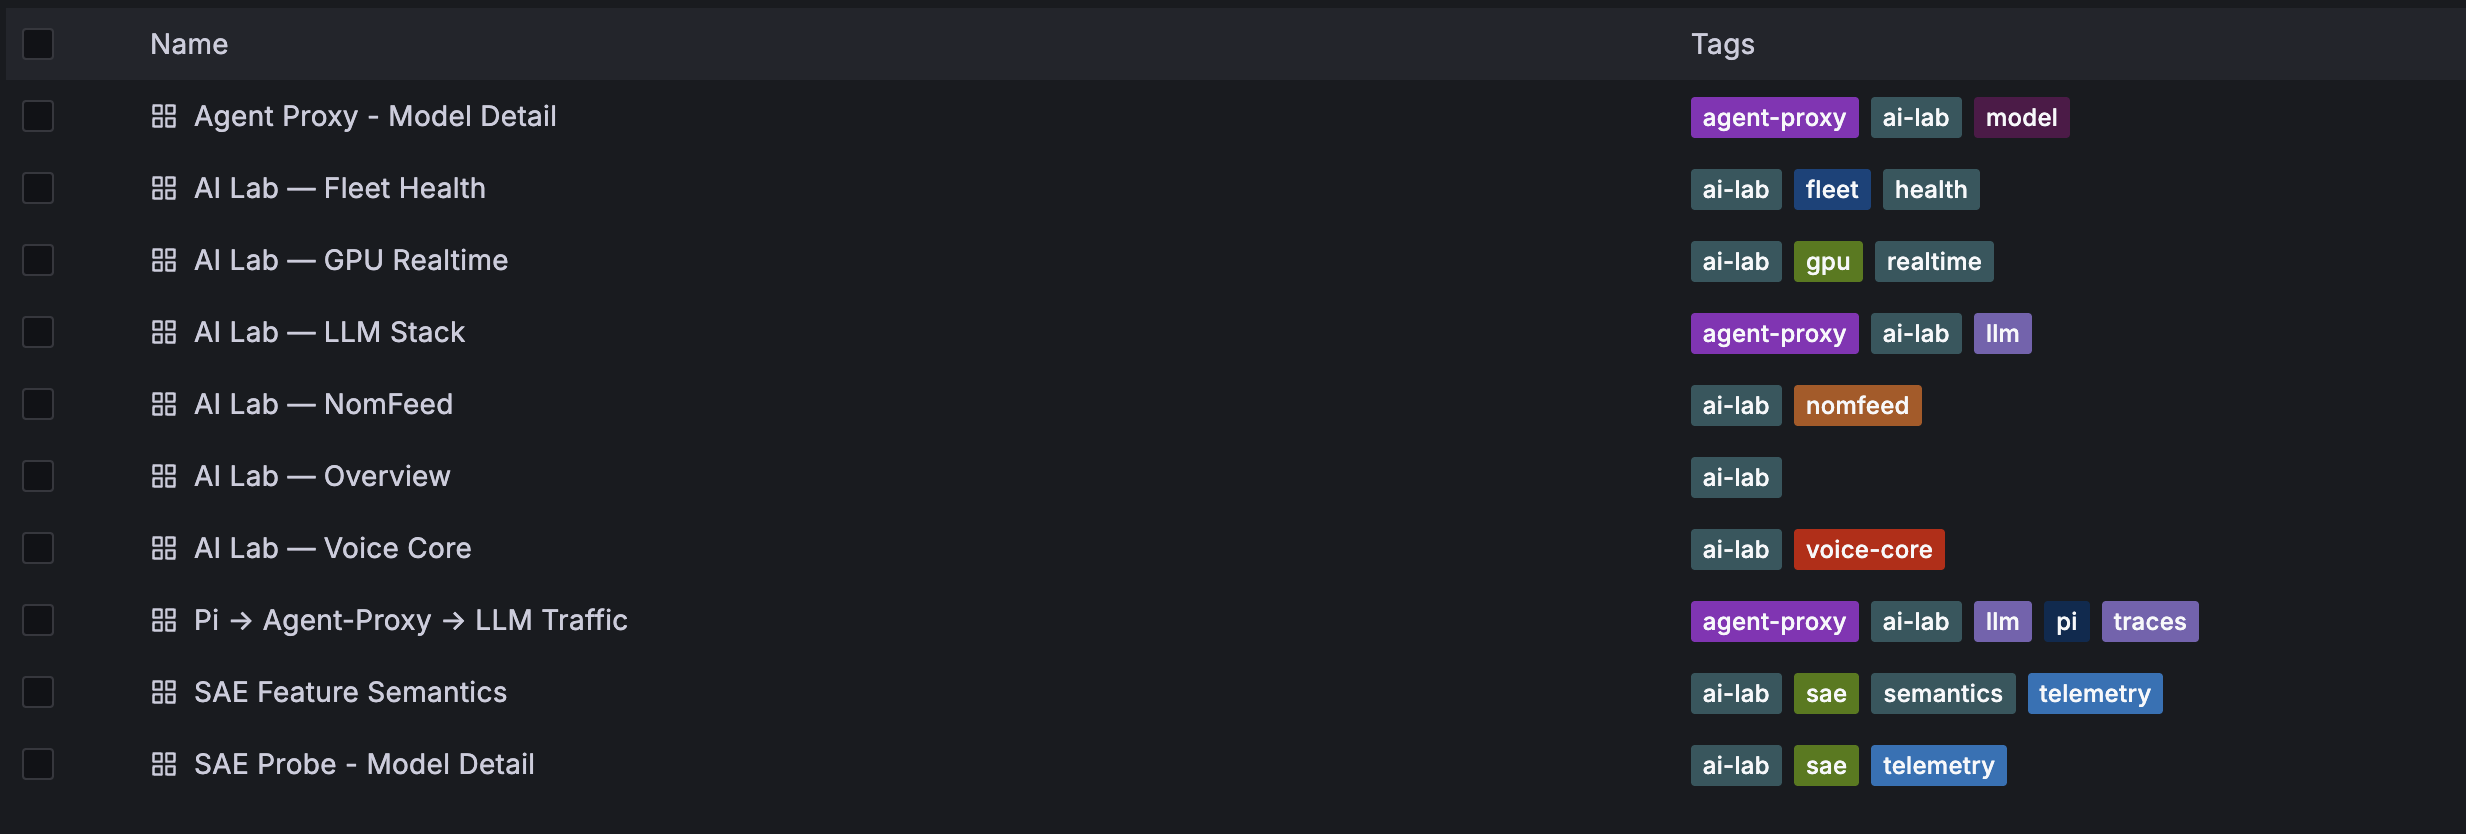
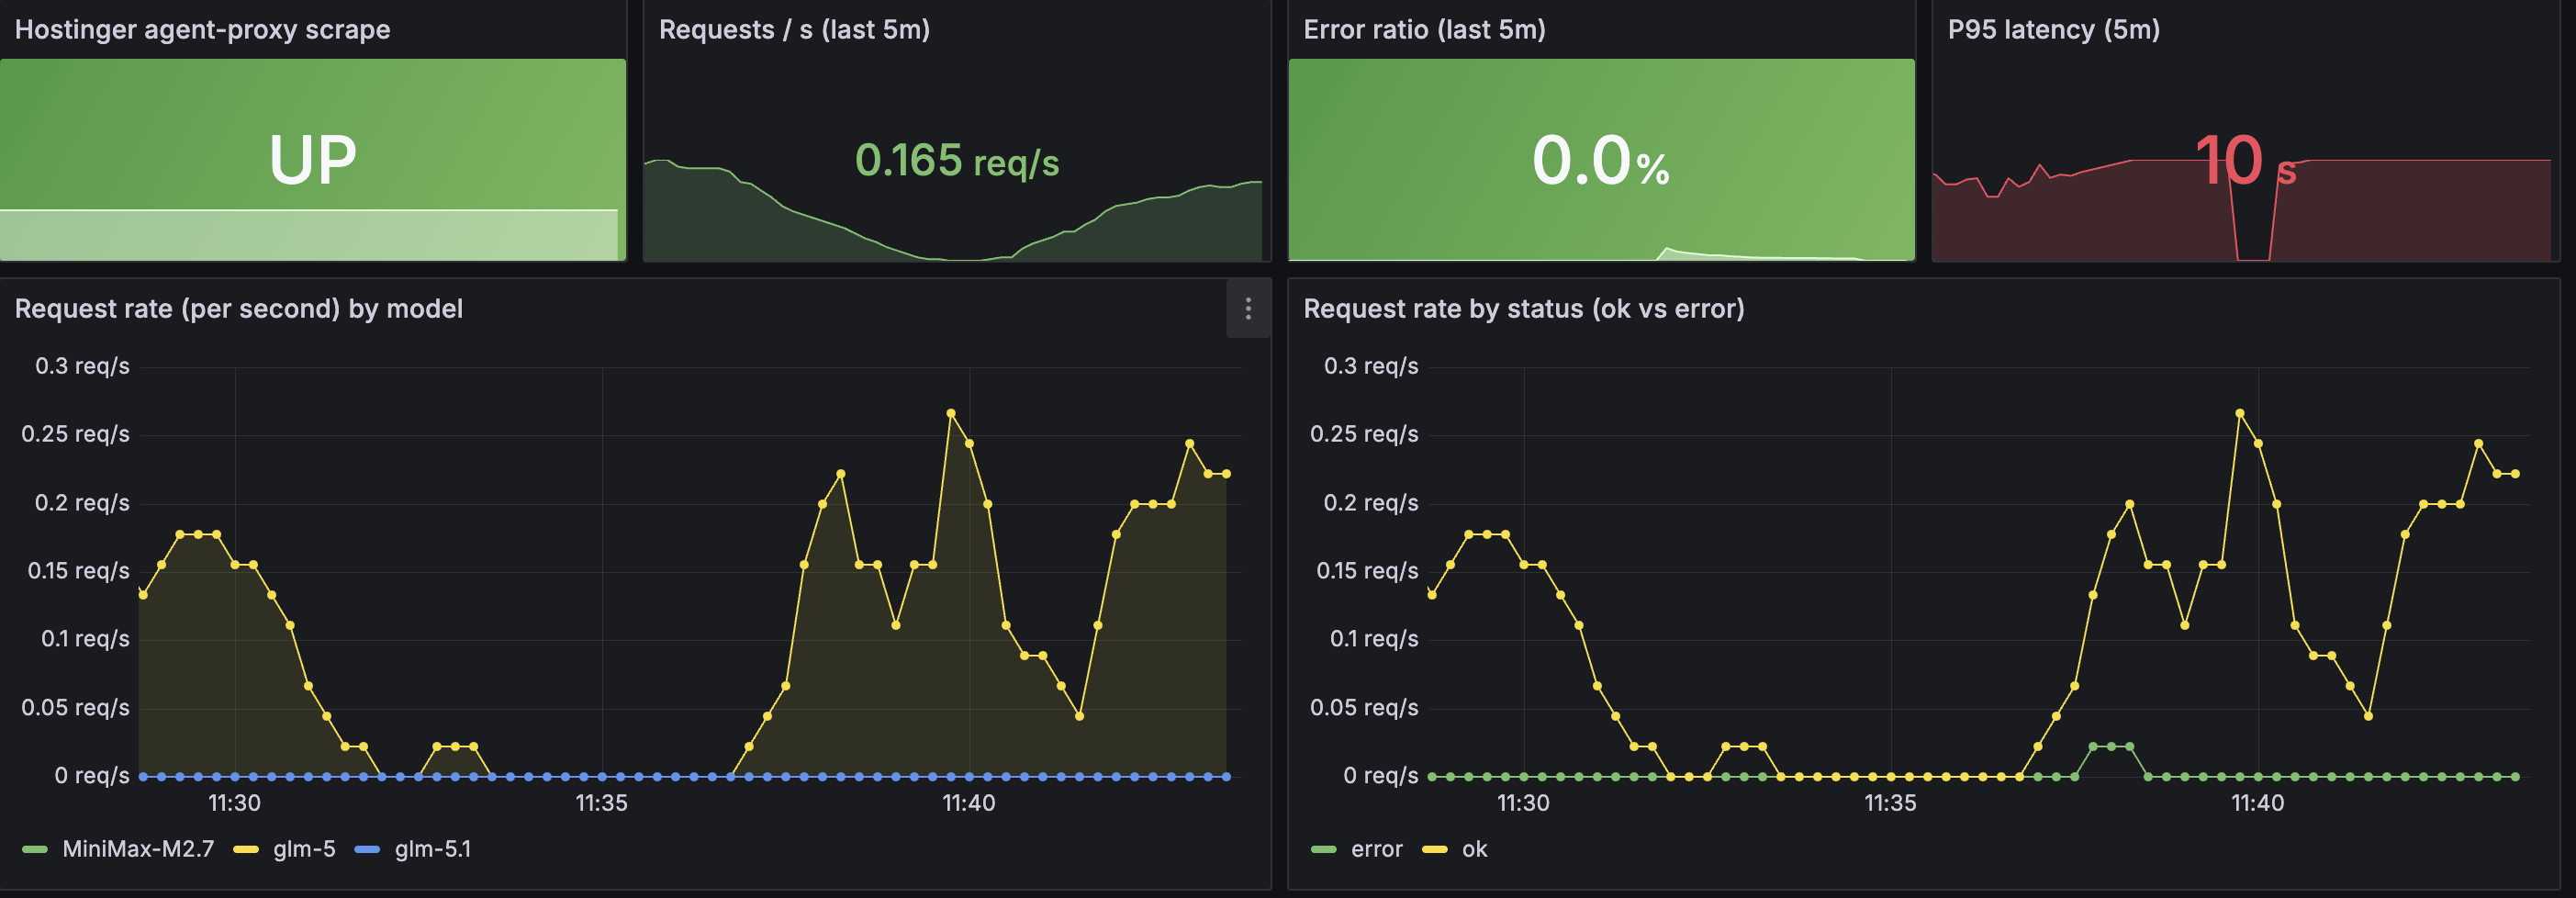
Agent Proxy, Model Detail gives me per-model breakdown: request rate, error rate, latency max over 5 minutes, input tok/s, output tok/s, cost per input token in USD, cost accrual over time. This is what I use to compare routing behavior between cloud and local providers.
SAE Probe, Model Detail tracks probe rate, failure rate, feature coverage, trace entry count, probe latency. Time series for coverage over time and activation token counts. This tells me whether the live SAE probe is healthy and what fraction of features are activating.
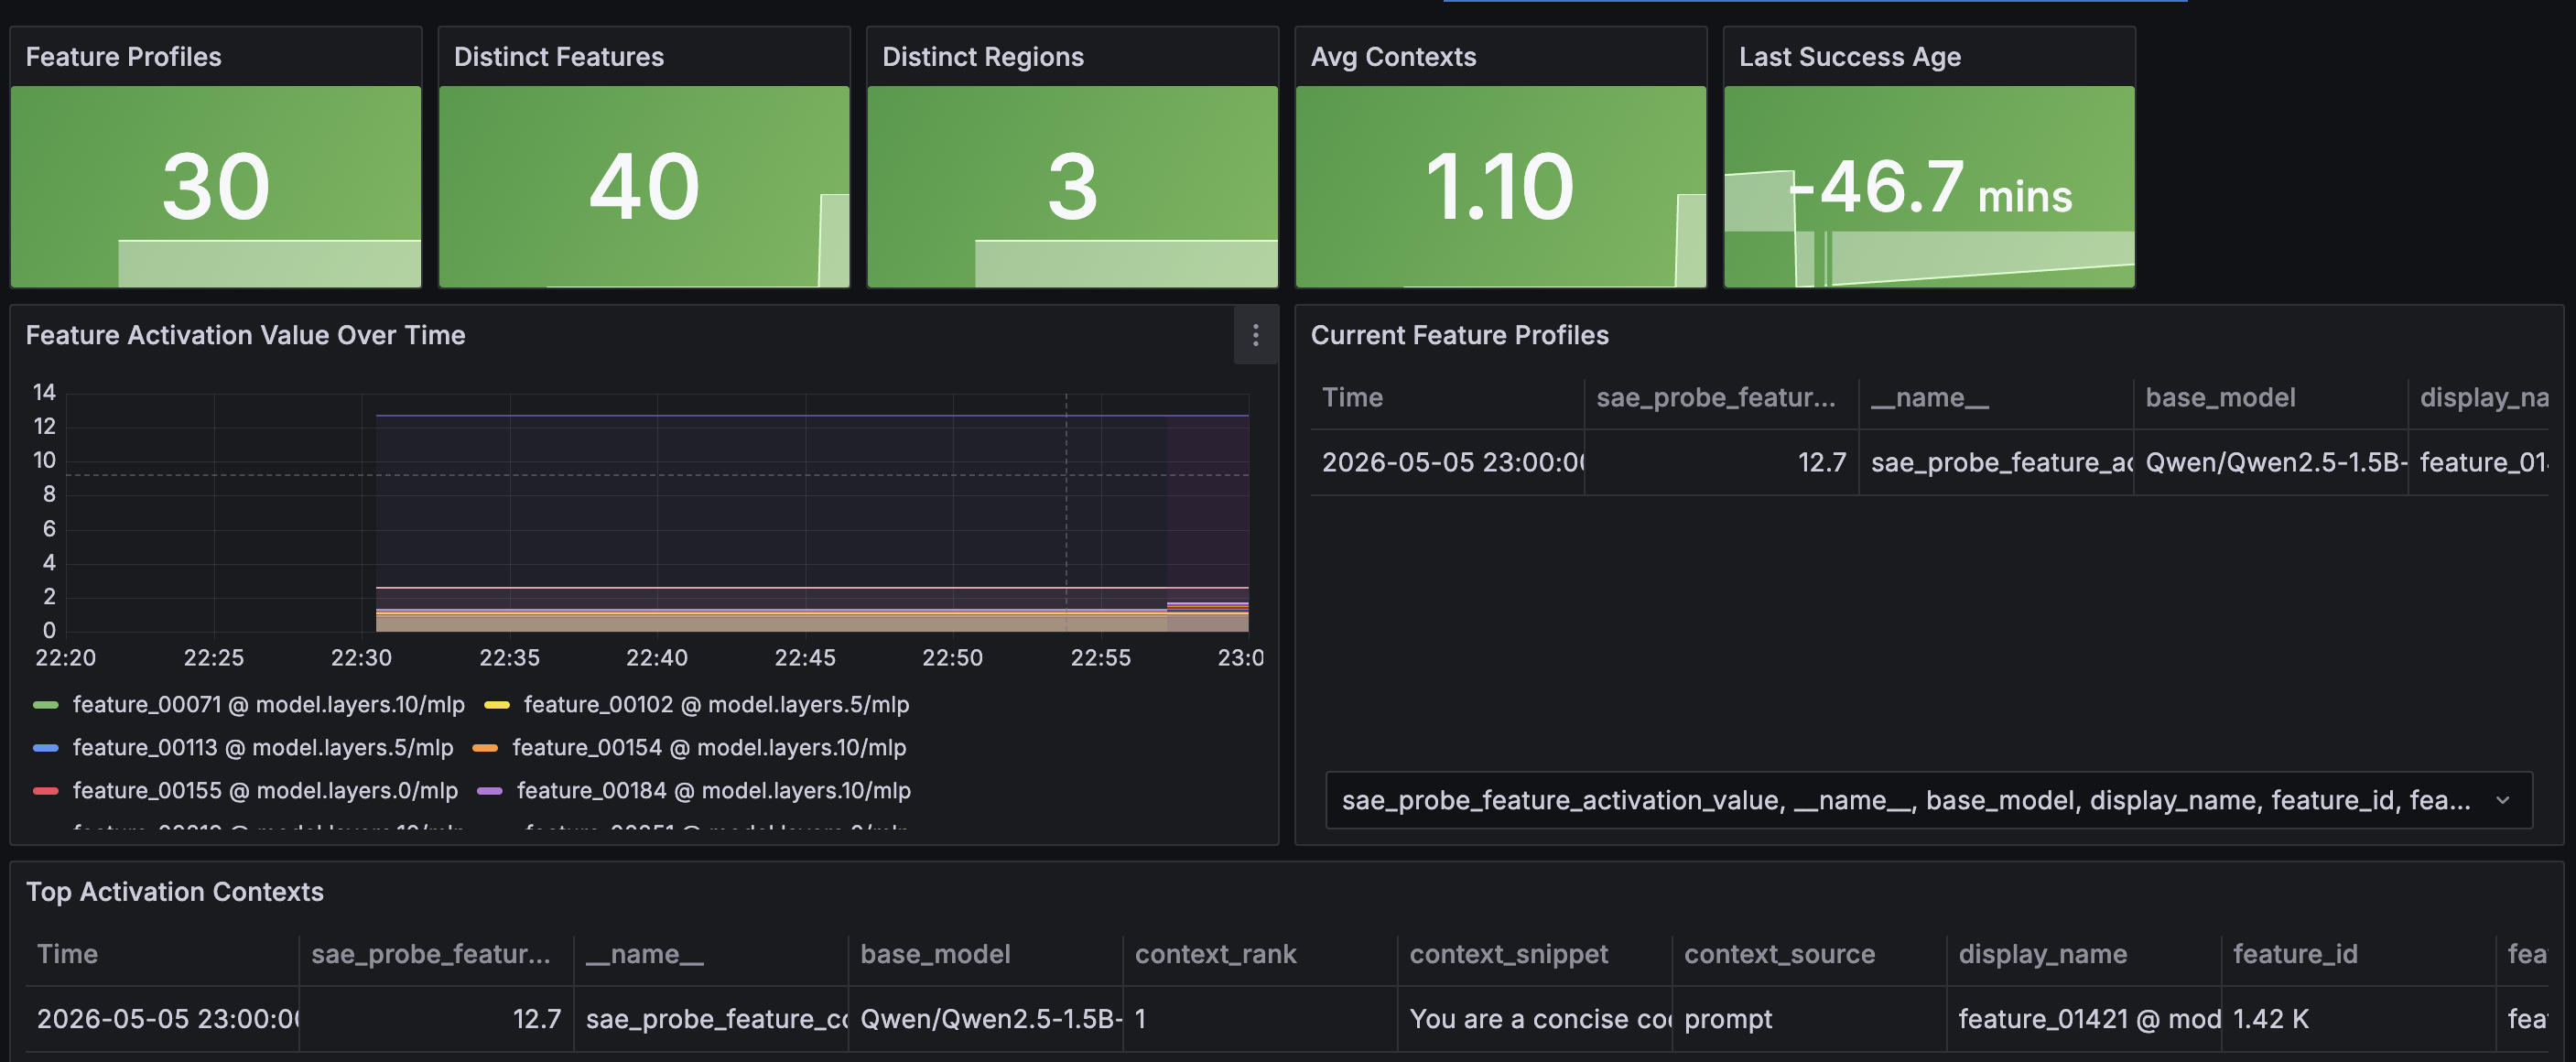
SAE Feature Semantics is the most interesting one. Populated from the in-memory feature profiles seeded from JSONL artifacts in data/sae_telemetry/raw/proxy-probes/. Shows feature profiles table with feature_name, region, display_name, activation_pattern, dominant_source, and learned_description. Top activation contexts: the highest-activation prompt/completion snippets per feature. Feature activation value over time: which features are firing on live traffic.
AI Lab Fleet Health covers node-level host metrics, GPU realtime panel, and LLM stack health.

Datasources are Prometheus (default) and Jaeger. The trace-to-metrics link is wired: a span in Jaeger links to the matching Prometheus metric series by service.name.
What the OTEL pipeline looks like end to end
coding agent (Pi / Codex / Claude Code) │ X-Harness-Id, X-Task-Id, X-Turn-Index headers ▼agent-proxy (:8686) │ GatewayEvent → events-YYYY-MM-DD.jsonl │ OTEL spans → Jaeger (:16686) │ Prometheus metrics → /metrics (:8686) ▼Prometheus (:9090) ← also scrapes: node_exporter, nvidia_gpu_exporter, vLLM /metrics (:8090), SAE probe (:18888) ▼Grafana (:3000) ← datasources: Prometheus + JaegerThe vLLM metrics endpoint (:8090) is scraped with a model: qwen3-coder-30b-a3b-awq label so Grafana can correlate inference engine behavior with gateway-level request traffic.
Qwen Scope: SAE Telemetry and Internal Activations
The SAE work is a separate layer sitting alongside the serving stack, not inside it. The goal: capture what Qwen models are “thinking about” at a feature level, using Sparse Autoencoders from the Qwen Scope release, and correlate that with output quality.
The model pairs
Qwen Scope is Qwen’s open release of Sparse Autoencoders trained on the Qwen model family residual streams. Each SAE maps a layer’s hidden state to a sparse set of interpretable features.
| SAE | Base model | VRAM | Status |
|---|---|---|---|
SAE-Res-Qwen3.5-2B-W32K-L0_50 | Qwen2.5-1.5B-Instruct | ~10 GB | Phase 1, active |
SAE-Res-Qwen3.5-2B-W32K-L0_100 | Qwen2.5-1.5B-Instruct | ~10 GB | Parallel test |
SAE-Res-Qwen3.5-9B-W64K-L0_50 | Qwen2.5-7B-Instruct | ~18 GB | Phase 2 |
Phase 1 uses the 1.5B base model because the 30B production model’s SAE doesn’t exist in the Qwen Scope release yet. The useful signal is in the architecture, not model size. The activation patterns translate.
How it works
The SAEActivationCapture class registers forward hooks on target transformer layers. On each forward pass, the hook intercepts the residual stream, encodes it through the SAE to get sparse feature activations, and applies top-k sparsity (k=50) to get the most active features. The result per request is a dict of layer_name → {feature_indices, feature_values}.
class SAEActivationCapture: def _hook_fn(self, layer_name): def hook(module, input, output): residual = output if isinstance(output, torch.Tensor) else output[0] encoded = self.sae.encode(residual) top_k = torch.topk(encoded, k=self.sparsity_target, dim=-1) self.feature_indices[layer_name] = top_k.indices.cpu() self.feature_values[layer_name] = top_k.values.cpu() return hookThe live probe server runs at 127.0.0.1:18888 and exposes Prometheus metrics. Prometheus scrapes it as the sae_probe job. That’s where the Grafana SAE dashboards get their data.
Feature profiles are built from accumulated JSONL artifacts and include human-readable descriptions: stable feature_name, parsed layer region, a learned_description inferred from top activating contexts, dominant_source (prompt, completion, or mixed), and top_contexts with activation values.
The probe server seeds its in-memory profiles from existing JSONL artifacts on startup, so the Grafana tables populate immediately after restart rather than waiting for fresh requests to warm them.

The longer-term use
The SAE activation data is one of three reward signal sources for eventual RL work. The plan is:
agent-proxyJSONL captures what the harness sent and what the model returned- SAE activations capture what the model was internally doing during that request
- Implicit signals (follow-up latency, corrections, session continuity) label whether the turn was productive
Together those three give me a preference dataset where “good” and “bad” responses have both behavioral labels and internal mechanistic signals attached.
What’s Next
The dataset collection pipeline (Layer A and B from the proxy telemetry spec) is the next thing I want to ship. The proxy already sees every request. The sanitizer already runs. The gap is writing the accumulated I/O to the io/ JSONL stream and verifying the schema holds across edge cases (streaming, tool calls, multi-turn). Once that’s running, the lab produces training signal automatically.
NomFeed context bundles as eval inputs is a longer-term goal. The idea is that a benchmark run is a NomFeed entry, and replaying that entry through a newer model gives me a direct before/after comparison without re-running the full harness.
If the agent-proxy telemetry dataset work interests you, the three-layer AI operations pattern covers a related design, building AI workflows around clean separation of interface, memory, and reasoning, which is essentially the same principle applied to operations rather than training data.
How I Got Here
This whole lab started from a 2020 gaming desktop: Ryzen 9 3900X, 64 GB RAM, RTX 2080 Super. The 2080 Super was fine for gaming and dev work. Then I wanted to run local LLMs and 8 GB VRAM became a hard ceiling. I could fit Qwen2.5-3B in GGUF and nothing else worth benchmarking.
So I added an RTX 3090. Same machine, same case. The 3090 handles inference. The 2080 Super still drives the display. The machine runs Ubuntu 24.04, reachable over Tailscale from anywhere.
This post is the write-up I wish existed before I started: what runs, why, what broke, what the benchmarks mean, and the investigation into FlashInfer that answered a question I wasn’t trying to ask.
Key Takeaways
- RTX 3090 hits two OOM cliffs with 30B MoE models: ≥25K tokens + TQ3 KV (prefill activation), and single prompt >50-60K (GDN state buffer)
- vLLM wins TTFT (p50 17ms); SGLang wins raw throughput (+9%); llama.cpp Q4_K_M wins recall quality at every context length tested
- FlashInfer is already auto-selected by vLLM 0.17.0 on Ampere with fp8_e4m3 KV — Triton can't handle that dtype on this hardware, so there's no A/B to run
- A 'SGLang beats vLLM on identical weights' finding inverted two days later due to Docker image version drift, not any config change
- Prometheus scrapes both the local GPU host and the Hostinger VPS agent-proxy via Tailscale — one Grafana instance, two deployment targets
- Qwen Scope SAE activations run as a live probe alongside serving, exposing feature coverage and learned semantic descriptions in Grafana
- agent-proxy is the right collection point for preference datasets — one proxy sees every harness without per-client instrumentation

Get Notified of New Posts
New posts on context engineering, AI agent architecture, and practical AI workflows. No spam. Unsubscribe anytime.